
The geomagnetic field was quiet on August 15. Solar wind speed at SOHO ranged between 376 and 490 km/sec. The high latitude magnetometer at Andenes recorded quiet to active levels.
Solar flux density measured at 20h UT on 2.8 GHz was 130.6 - decreasing 13.5 over the previous solar rotation. (Centered 1 year average SF at 1 AU - 183 days ago: 108.41). The Potsdam WDC planetary A index was 5 (STAR Ap - based on the mean of three hour interval ap indices: 4.8). Three hour interval K indices: 11112211 (planetary), 11212301 (Boulder), 12124411 (Andenes).
The background x-ray flux is at the class B7 level (GOES 16).
At the time of counting spots (see image time), spots were observed in 15 active regions using 2K resolution (SN: 302) and in 13 active regions using 1K resolution (SN: 219) SDO/HMI images.
Region 13074 [S17W63] was quiet and stable.
Region 13075 [N22W42] was quiet and stable.
Region 13076 [N15W35] decayed significantly
losing all mature penumbra.
Region 13078 [S24W06] developed quickly becoming a very compact and
complex region. Major flares are possible as long as the multiple magnetic
delta structures remain. C1 flares: C1.3 @ 07:15, C1.9 @ 08:11, C1.6 @
09:25, C1.7 @ 13:59, C1.1 @ 22:50 UT. The region was the source of a major
M5.0 flare at 07:58 UT on August 16.
Region 13079 [S10W51] gained spots and could produce minor M class
flares. C1 flares: C1.0 @ 19:21, C1.7 @ 23:17 UT
Region 13081 [N11E17] decayed slowly and was mostly quiet. C1 flares:
C1.4 @ 09:08 UT
Spotted regions not observed (or interpreted
differently) by SWPC:
S7766 [S11E08] developed slightly and was quiet.
S7767 [N17W34] was quiet and stable.
S7776 [N20W38] decayed quickly and was quiet.
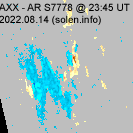
S7778 [S10E59] developed slowly and quietly.
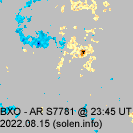
New region S7781 [N23E19] emerged before noon with tiny spots.
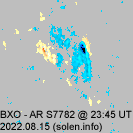
New region S7782 [N17W64] emerged with tiny spots.
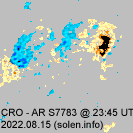
New region S7783 [S24W17] emerged to the west of AR 13078 with a few
spots.
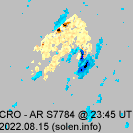
New region S7784 [N27E62] emerged with a few spots late in the day.
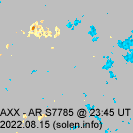
New region S7785 [N16E38] emerged with a tiny spot.
C2+ flares:
| Magnitude | Peak time (UT) | Location | Source | Recorded by | Comment |
| C3.5 | 05:07 | S21W43 | 13074 | GOES16 | LDE, CME |
| C2.5 | 06:13 | 13078 | GOES16 | ||
| C2.6 | 09:43 | 13078 | GOES16 | ||
| C3.1 | 11:10 | 13078 | GOES16 | ||
| C2.3 | 12:00 | 13079 | GOES16 | ||
| C2.7 | 12:12 | 13079 | GOES16 | ||
| C3.5 | 12:49 | 13079 | GOES16 | ||
| M1.0/1N | 14:36 | S24W00 | 13078 | GOES16 | |
| C2.5 | 16:09 | 13079 | GOES16 | ||
| C7.0 | 16:49 | 13078 | GOES16 | ||
| M2.7/1N | 16:54 | S23W01 | 13078 | GOES16 | |
| C9.9/1F | 17:33 | S10W49 | 13079 | GOES16 | LDE |
| C3.9 | 19:51 | 13078 | GOES16 | ||
| C2.3 | 20:32 | S10W49 | 13079 | GOES16 | |
| C2 estimated | 21:24 | 13079 | estimated from SDO data | ||
| M1.1 | 21:53 | S24W05 | 13078 | GOES17 |
August 13: No obviously Earth directed CMEs
were observed in available LASCO imagery.
August 14: A partial halo CME was observed after a long duration C2
event, mainly in AR S7767 but also extending northwards to AR S7776, peaking
just after noon. The CME could reach Earth on August 17.
August 15: A partial halo CME was observed after the long duration C3
event in AR 13074 early in the day.
[Coronal hole history (since October 2002)]
[Compare today's report to the situation one solar rotation ago:
28 days ago
27 days ago
26 days ago]
A boomerang shaped recurrent trans equatorial coronal hole (CH1094) will rotate across the central meridian on August 14-17.

Long distance low and medium frequency (below 2 MHz) propagation along paths north of due west over upper middle and high latitudes is poor to fair. Propagation on long distance northeast-southwest paths is poor.
Quiet conditions are likely on August 16. Quiet to minor storm conditions is expected for August 17-20 due to effects from CH1094 and the August 14 and 15 CMEs. Major stoprm intervals are possible
| Coronal holes (1) | Coronal mass ejection (2) | M and X class flares (3) |
1) Effects from a coronal hole
could reach Earth within the next 5 days. When the high speed
stream has arrived the color changes to green.
2) Effects from a CME are likely to be observed at Earth within 96 hours.
3) There is a possibility of either M or X class flares within the next 48 hours.
Green: 0-30% probability, Yellow: 30-70% probability, Red: 70-100% probability.

(Click on image for 2K resolution).
4K resolution.
Compare to the previous day's image. 0.5K image
When available the active region map has a coronal hole polarity overlay where red (pink) is negative and blue is positive.
Data for all officially numbered solar regions according to the Solar Region Summary provided by NOAA/SWPC, all other regions are numbered sequentially as they emerge using the STAR spot number. Comments are my own, as is the STAR spot count (spots observed at or inside a few hours before midnight) and data for regions not numbered by SWPC or where SWPC has observed no spots. SWPC active region numbers in the table below and in the active region map above are the historic SWPC/USAF numbers. SWPC data considered to be not sufficiently precise (location, area, classification) are colored red.
| Active region | SWPC date numbered STAR detected |
Spot count | Location at midnight | Area | Classification | SDO / HMI 4K continuum image with magnetic polarity overlays |
Comment | ||||
|---|---|---|---|---|---|---|---|---|---|---|---|
| SWPC/ USAF |
Magnetic (SDO) |
SWPC | STAR | Current | Previous | ||||||
| 2K | 1K | ||||||||||
| 13074 | 2022.08.04 2022.08.05 |
1 | 2 | 2 | S17W64 | 0090 | HSX | HAX |
 |
 |
location: S17W63 |
| 13075 | 2022.08.05 2022.08.07 |
3 | N18W58 | 0005 | BXO |
 |
 |
location: N22W42 | |||
| 13076 | 2022.08.06 2022.08.07 |
3 | 9 | 5 | N16W36 | 0060 | CAO | CRI |
 |
 |
SWPC includes AR S7767 in this group location: N15W35 area: 0030 |
| 13077 | 2022.08.07 2022.08.09 |
S18W88 | location: S17W84 | ||||||||
| 13078 | 2022.08.09 2022.08.10 |
12 | 27 | 20 | S24W05 | 0230 | DAC | DKC |
 |
 |
beta-gamma-delta area: 0430 location: S24W06 |
| S7766 | 2022.08.10 | 4 | 2 | S11E08 | 0010 | BXO |
 |
 |
|||
| S7767 | 2022.08.11 | 8 | 3 | N17W34 | 0012 | BXO |
 |
 |
reversed polarities | ||
| 13081 | 2022.08.11 2022.08.13 |
16 | 33 | 21 | N12E18 | 0220 | DAO | DAI |
 |
 |
location: N11E17 area: 0310 |
| 13080 | 2022.08.11 2022.08.12 |
 |
location: N19W78 |
||||||||
| 13079 | 2022.08.11 2022.08.12 |
10 | 34 | 18 | S11W52 | 0140 | CAO | DAI |
 |
 |
beta-gamma location: S10W51 |
| S7771 | 2022.08.11 | S27W12 |
 |
||||||||
| S7773 | 2022.08.12 | N23W25 | |||||||||
| S7774 | 2022.08.13 | S12W37 | |||||||||
| S7775 | 2022.08.13 | N36W09 | |||||||||
| S7776 | 2022.08.14 | 8 | 5 | N20W38 | 0025 | DRI |
 |
 |
|||
| S7777 | 2022.08.14 | N26W13 | |||||||||
| S7778 | 2022.08.14 | 8 | 3 | S10E59 | 0017 | BXO |
 |
 |
|||
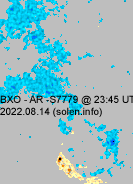
| S7779 | 2022.08.14 | N11W00 |
 |
||||||||
| S7781 | 2022.08.15 | 2 | 2 | N23E19 | 0005 | BXO |
 |
||||
| S7782 | 2022.08.15 | 2 | 1 | N17W64 | 0007 | BXO |
 |
||||
| S7783 | 2022.08.15 | 6 | 3 | S24W17 | 0030 | CRO |
 |
||||
| S7784 | 2022.08.15 | 5 | 4 | N27E62 | 0015 | CRO |
 |
||||
| S7785 | 2022.08.15 | 1 | N16E38 | 0002 | AXX |
 |
|||||
| Total spot count: | 42 | 152 | 89 | ||||||||
| Sunspot number: | 92 | 302 | 219 | (total spot count + 10 * number of spotted regions) | |||||||
| Weighted SN: | 67 | 189 | 126 | (Sum of total spot count + classification weighting for each AR. Classification weighting: X=0, R=3, A/S=5, H/K=10) | |||||||
| Relative sunspot number (Wolf number): | 101 | 166 | 175 | ||||||||
| Month | Average solar flux | International sunspot number (WDC-SILSO) |
Smoothed sunspot number (4) | Average ap (3) |
|
|---|---|---|---|---|---|
| Measured | 1 AU | ||||
| 2014.02 | 170.3 (cycle peak) |
166.3 | 146.1 (SC24 peak) | 110.5 | 10.70 |
| 2014.04 | 143.9 | 144.8 | 112.5 | 116.4 (solar max) | 7.88 |
| 2017.09 | 91.3 | 92.3 | 43.6 | 18.2 (-1.3) | 18.22 (cycle peak) |
| 2019.11 | 70.2 | 68.7 | 0.5 | 2.0 (-0.6) (Solar minimum using 365d smoothing: November 17, 2019) |
4.19 |
| 2019.12 | 70.8 | 68.6 | 1.6 | 1.8 (-0.2) (ISN 13 months smoothed solar minimum) |
3.22 |
| 2021.01 | 76.0 | 73.6 | 10.4 | 17.3 (+2.0) | 4.39 |
| 2021.02 | 74.3 | 72.4 | 8.2 | 19.0 (+1.7) | 9.50 |
| 2021.03 | 76.0 | 75.2 | 17.2 | 21.7 (+2.7) | 10.17 |
| 2021.04 | 75.9 | 76.4 | 24.5 | 24.8 (+3.1) | 8.40 |
| 2021.05 | 75.3 | 77.1 | 21.2 | 25.8 (+1.0) | 6.50 |
| 2021.06 | 79.4 | 81.8 | 25.0 | 27.6 (+1.8) | 5.52 |
| 2021.07 | 81.0 | 83.6 | 34.3 | 31.4 (+3.8) | 5.51 |
| 2021.08 | 77.7 | 79.7 | 22.0 | 35.4 (+4.0) | 6.19 |
| 2021.09 | 87.0 | 88.2 | 51.3 | 40.2 (+4.8) | 6.33 |
| 2021.10 | 88.9 | 88.3 | 37.4 | 45.2 (+5.0) | 7.38 |
| 2021.11 | 86.2 | 84.4 | 34.8 | 50.8 (+5.6) | 9.83 |
| 2021.12 | 103.0 | 99.8 | 67.5 | 55.9 (+5.1) | 6.40 |
| 2022.01 | 103.8 | 100.5 | 55.3 | 60.1 (+4.2) | 8.92 |
| 2022.02 | 109.1 | 106.5 | 60.9 | (65.8 projected, +5.7) | 10.46 |
| 2022.03 | 117.0 | 115.8 | 78.6 | (70.8 projected, +5.0) | 10.20 |
| 2022.04 | 130.8 | 131.7 | 84.1 | (75.9 projected, +5.1) | 11.79 |
| 2022.05 | 133.8 | 136.8 | 96.5 | (82.4 projected, +6.5) | 7.48 |
| 2022.06 | 116.1 | 119.8 | 70.5 | (88.3 projected, +5.9) | 8.20 |
| 2022.07 | 125.4 | 129.5 | 91.4 | (95.5 projected, +7.2) | 9.51 |
| 2022.08 | 112.7 (1) | 32.8 (2A) / 67.8 (2B) / 93.1 (2C) | (102.0 projected, +6.5) | (10.4) | |
| 2022.09 | (106.9 projected, +4.9) | ||||
| 2022.10 | (110.1 projected, +3.2) | ||||
| 2022.11 | (112.9 projected, +2.8) | ||||
| 2022.12 | (117.7 projected, +4.8) | ||||
| 2023.01 | (123.7 projected, +6.0) | ||||
| 2023.11 | (142.5 projected max SC25) | ||||
1) Running average based on the daily 20:00 UTC observed solar flux value at 2800 MHz
and any corrections applied to that measurement.
2A) Current impact on the monthly sunspot number based on the Boulder (NOAA/SWPC) sunspot number (accumulated daily sunspots / month days).
2B) Boulder SN current month average to date.
2C) STAR SDO 1K Wolf number 30 day average.
3) Running average based on the quicklook and definitive Potsdam WDC ap indices. Values in red
are based on the definitive international
GFZ Potsdam WDC ap indices.
4) Source: SIDC-SILSO.

This report has been prepared by Jan Alvestad. It is based on the analysis of data from whatever sources are available at the time the report is prepared. All time references are to Universal Time. Comments and suggestions are always welcome.
SDO images are courtesy of NASA/SDO and the AIA, EVE, and HMI science teams.