12918
N20E65 Data 2021-12-21
Long Jupiter 46 area 20
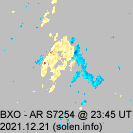 New region 12918 [N20E65] 20 emerged on December 21 as S7254 [N20E65]
report(past month only)
12918
N20E52 Data 2021-12-22
Long Jupiter 60 area 20
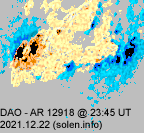 New region 12918 [N20E52] 20 emerged on December 21 with NOAA/SWPC numbering the region the following day. The region developed fairly quickly on December 22. C1 flares: C1.3 @ 20:46 UT.
report(past month only)
12918
N20E40 Data 2021-12-23
Long Jupiter 73 area 80
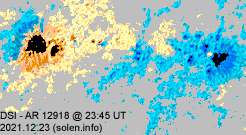 Region 12918 [N20E40] 80 displayed no major changes. C1 flares: C1.3 @ 20:46 UT.
report(past month only)
12918
N20E27 Data 2021-12-24
Long Jupiter 86 area 120
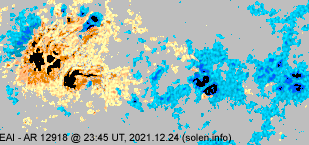 Region 12918 [N20E27] 120 developed and gained area. C and M class flaring is possible.
report(past month only)
12918
N18E01 Data 2021-12-26
Long Jupiter 114 area 260
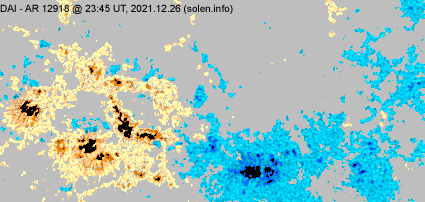 Region 12918 [N18E01] 260 has many spots and M class flaring is possible. C1 flares: C1.8 @ 00:21 UT.
report(past month only)
12918
N19W14 Data 2021-12-27
Long Jupiter 130 area 180
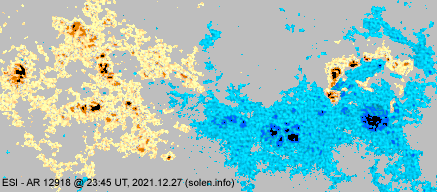 Region 12918 [N19W14] 180 displayed general decay, however, a new region emerged near the leader spots and eventually merged with AR 12918. Opposite polarity spots in the trailing spot section caused instability and the region has produced 2 M class flares so far on December 28. C1 flares: C1.4 @ 19:48 UT.
report(past month only)
12918
N19W29 Data 2021-12-28
Long Jupiter 146 area 180
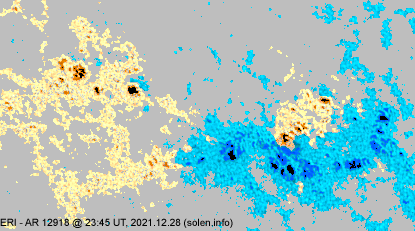 Region 12918 [N19W29] 180 decayed in the trailing and central spot sections while development was observed in the unstable leading spot section. No spots had mature penumbra by the end of the day. C1 flares: C1.2 @ 00:32, C1.3 @ 00:47, C1.3 @ 06:11, C1.0 @ 15:14 UT.
report(past month only)
12918
N19W41 Data 2021-12-29
Long Jupiter 159 area 210
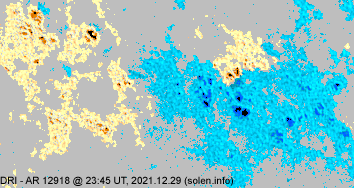 Region 12918 [N19W41] 210 decayed slowly and was mostly quiet.
report(past month only)
12918
N19W55 Data 2021-12-30
Long Jupiter 173 area 60
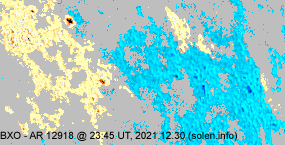 Region 12918 [N19W55] 60 decayed fairly quickly and was quiet until 04:54 UT (C1.9 flare) and 06:56 UT on December 31 when a C9.8 flare was recorded. That flare triggered a filament eruption as well.
report(past month only)
12918
N19W70 Data 2021-12-31
Long Jupiter -170 area 20
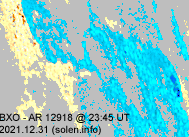 Region 12918 [N19W70] 20 decayed slowly and became unstable producing several C flares. C1 flares: C1.9 @ 04:54 UT
report(past month only)
12918
N19W78 Data 2022-01-02
Long Jupiter -160 area 10
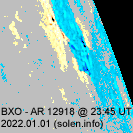 Region 12918 [N19W78] 10 developed slowly with tiny spots emerging.
report(past month only)